Armed Conflict & Expenditure Analysis
A full-stack visualization tool exploring the relationship between global armed conflicts and military spending from 1960-2021.
The Problem
Understanding the relationship between military spending and armed conflicts requires analyzing decades of complex data across hundreds of countries. Researchers and analysts lack accessible tools to visualize these patterns and compare defense spending trends between nations.
The Solution
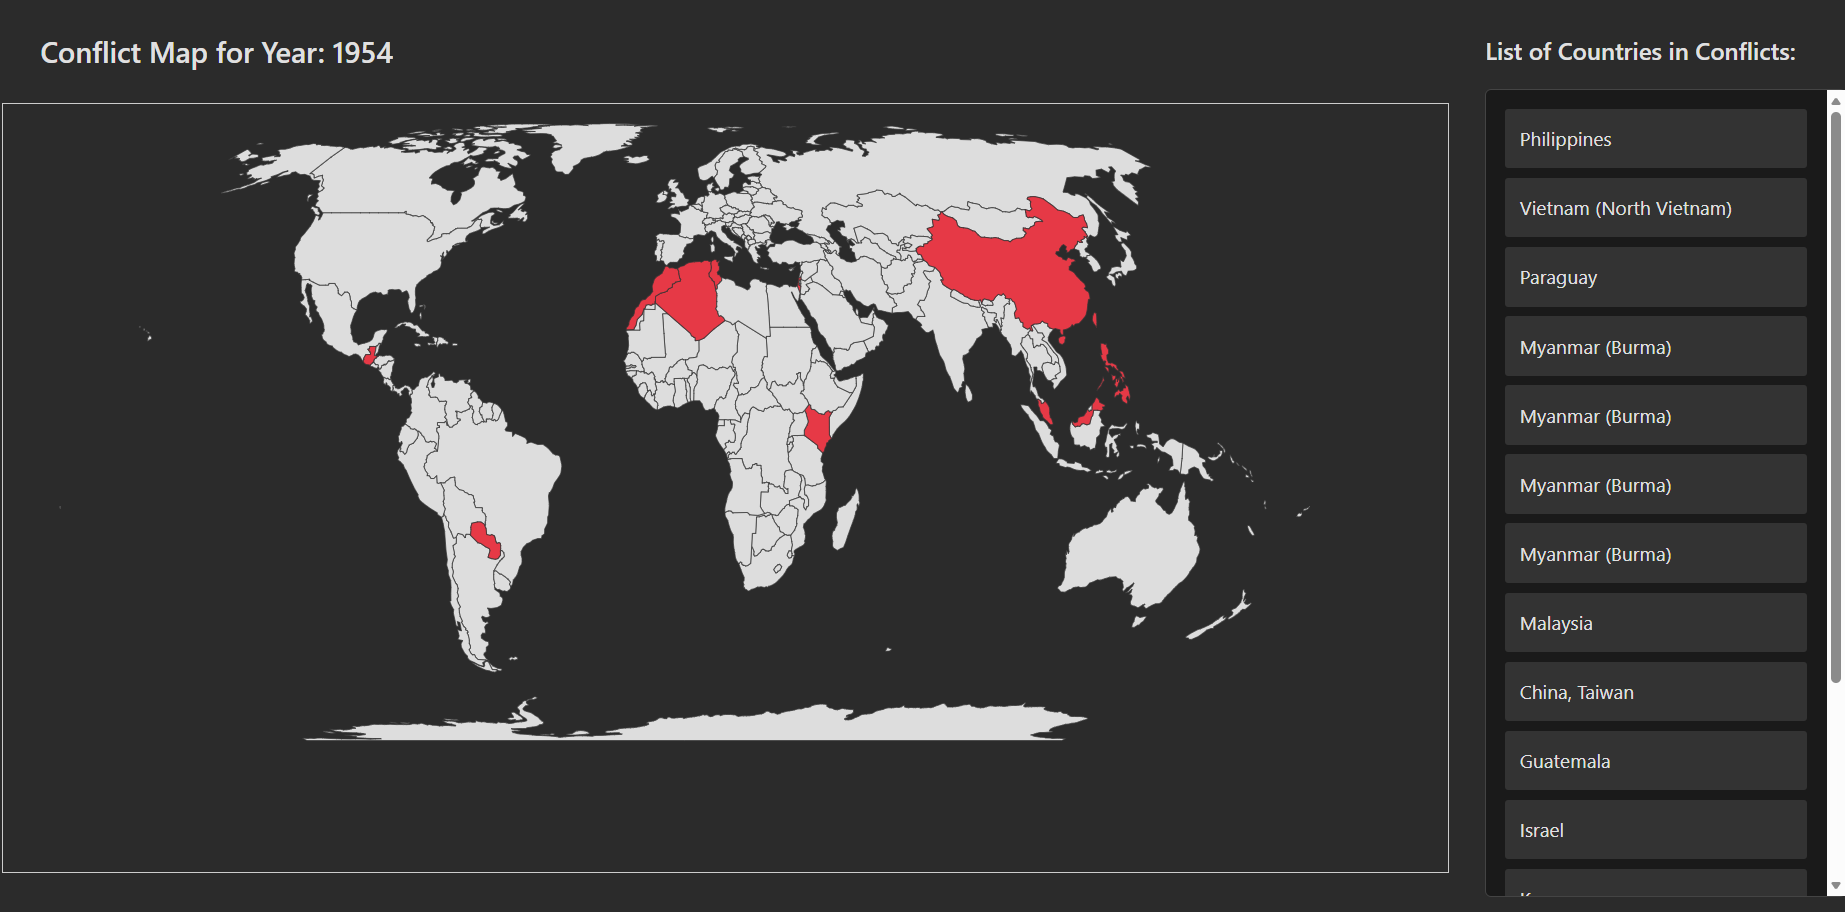
Built a full-stack application using React and Express that combines two comprehensive datasets: global armed conflicts (1989-2021) and military expenditure (1960-2019). The app features interactive maps with react-simple-maps, time-series charts with Chart.js, and a country comparison dashboard with parallel data fetching.
Technical Highlights
- Implemented server and browser caching with a global cache middleware, reducing TTFB to 6ms on repeat visits
- Applied React.lazy/Suspense for lazy-loading heavy components (Chart.js, maps), improving Lighthouse score from 57 to 81
- Built MongoDB aggregation pipelines for efficient data queries and comparison statistics
- Deployed on both Render (auto-deploy) and AWS Lightsail with GitLab CI/CD pipeline
Outcome
Improved initial load performance by 67% (FCP from 5.4s to 1.8s) through compression, lazy loading, and caching strategies. The documented optimization process in Performance.md serves as a reference for systematic web performance improvement.